


Seven Basic Quality Tools
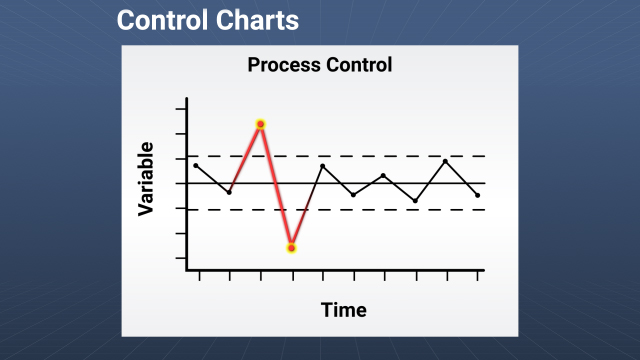
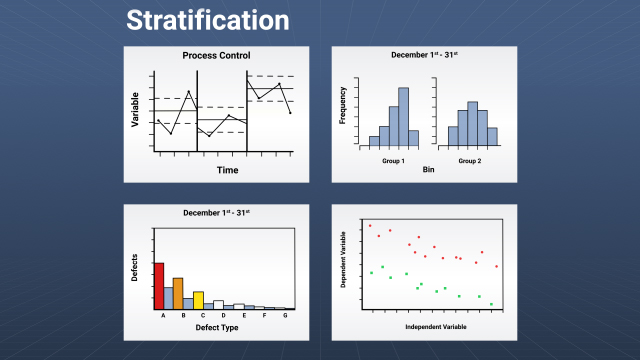
The seven basic quality tools are a set of commonly used graphical statistical analysis tools. They can be used to help solve many different types of problems, not just quality problems. The seven tools are: cause and effect diagrams, check sheets, control charts, histograms, Pareto charts, scatter plots, and data stratification. It is important to understand the purpose of each of these tools and how to interpret the information. This course provides a summary of each tool, including common uses.


Demos + Pricing
Learn more about our courses, get pricing, and see our platform.
Course Details
Learning Objectives
• List the seven basic quality tools • Describe each of the tools and how they can be utilized
Specs
Frequently Asked Questions
What is a check sheet used for?
What is a histogram?
What is a Pareto chart?
What is a scatter plot?
What are the 6 Ms?
Sample Video Transcript
The seven basic quality tools are a set of commonly used graphical statistical analysis tools. They can be used to help solve many different types of problems, not just quality problems. The seven tools are: • Cause and effect, or fishbone, diagrams • Check sheets • Control charts • Histograms • Pareto charts • Scatter plots • Data stratification (classification) Most of the time you will end up using a combination of these tools. Each tool will now be described in more detail.